Free
Findings dashboard
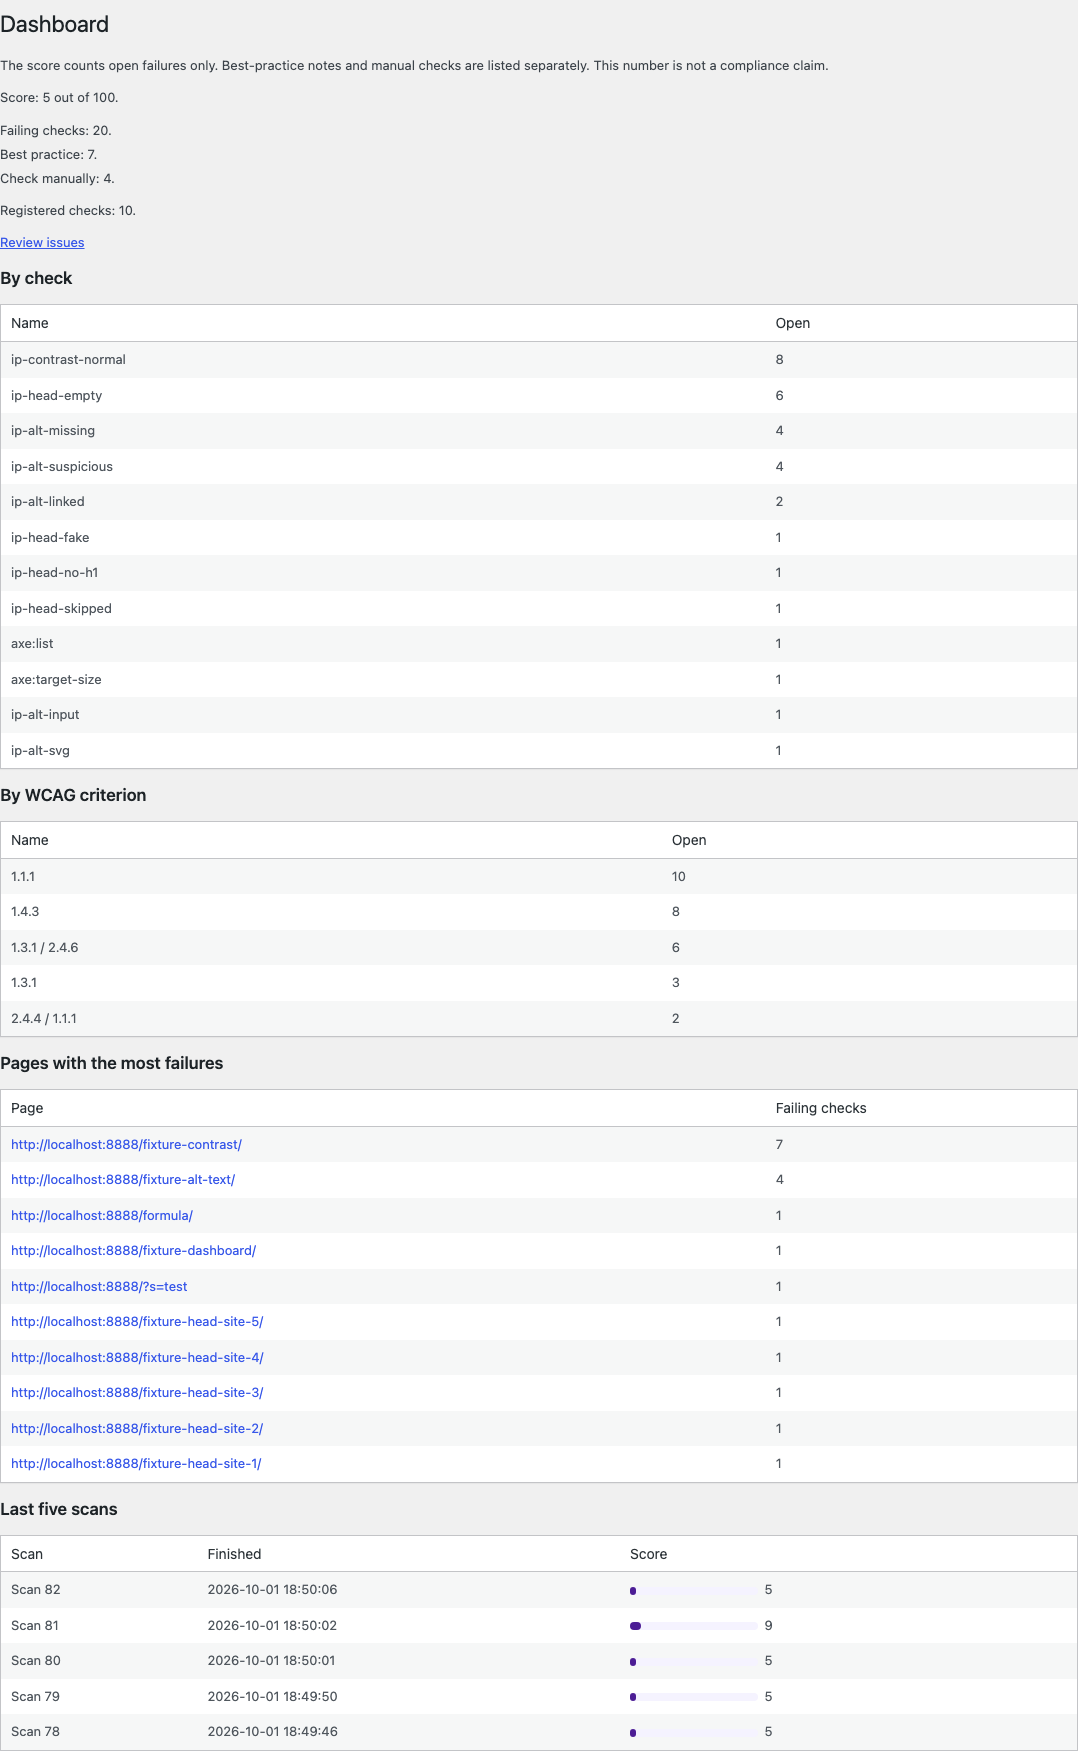
The dashboard is the daily list. The score counts open failures only. Best-practice notes and manual checks are listed beside it. The number is not a compliance claim.
What the free dashboard shows
- A score from 0 to 100. Open failures lower it. Each check is capped, and advisories and manual checks do not change the number.
- Open findings grouped by check and by WCAG criterion, plus the ten pages with the most failures.
- The last five completed scans, as a table. A bar beside each score repeats the same number.
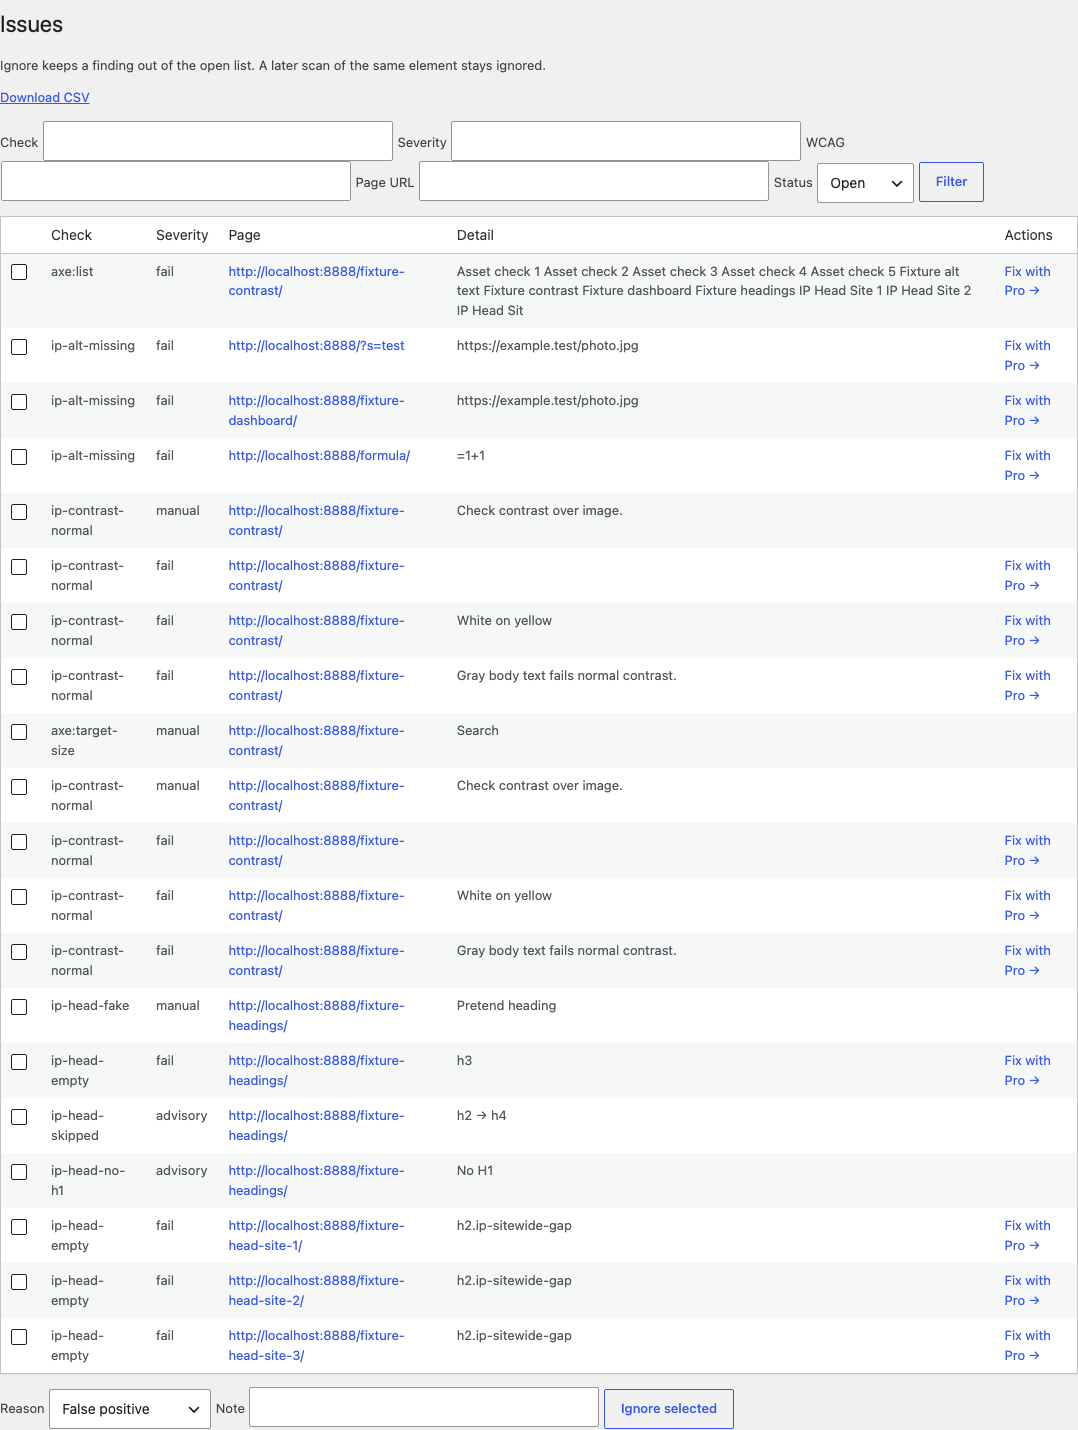
- Ignore asks for a reason: false positive, decorative, handled elsewhere, or other with a note. The next scan of that same element stays ignored.
- A CSV of the open list. A cell that starts with =, +, -, or @ is stored as text.
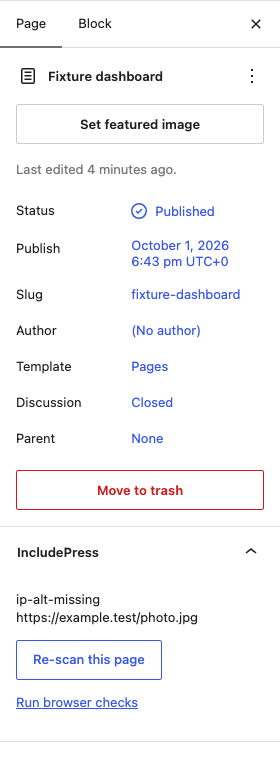
- An IncludePress panel in the editor for the page you are writing, with Re-scan this page.
The Dashboard screen
This screenshot is from a local WordPress admin. The marketing site does not run the plugin. The score on that local site is 5 because the fixture pages still fail on purpose.
The Issues screen
Filters cover the check, severity, WCAG criterion, page, and status. Ignore selected applies one reason to the checked rows. Fix with Pro is a text link on failures. It does not change the page.
While you write
The block editor sidebar lists open findings for the current page and can re-scan that page with the server engine. Browser checks stay on the Scans screen.
Limitation. The free dashboard lists problems. It does not change the page.